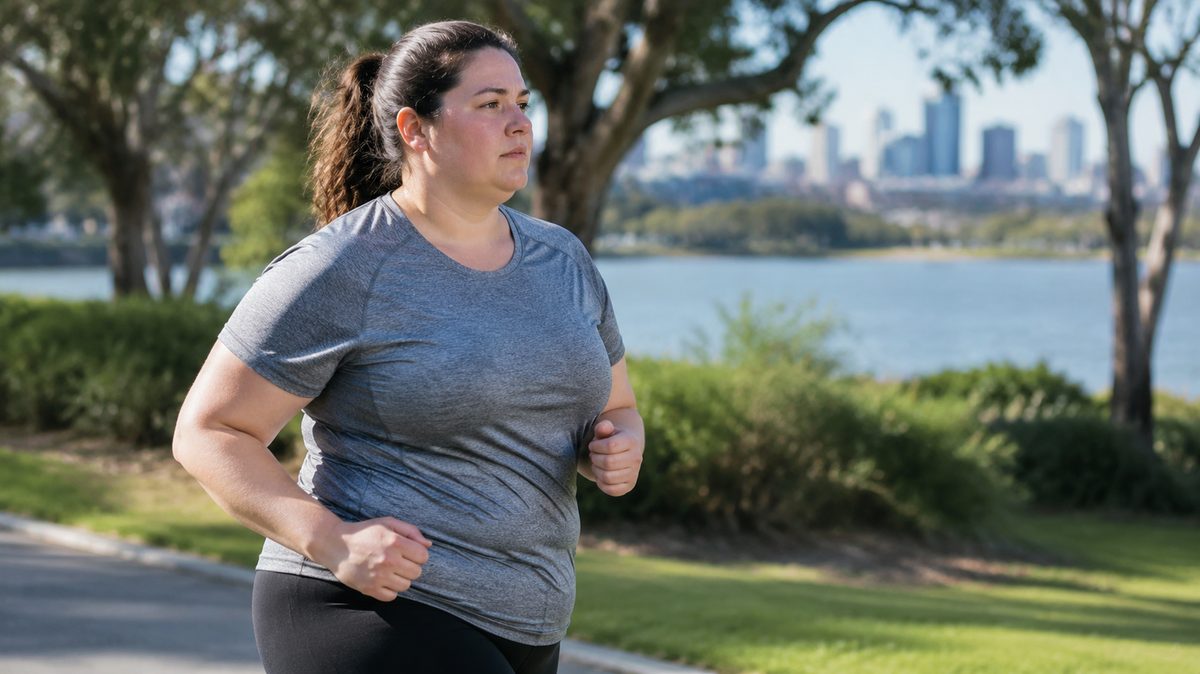
About one in three Australian adults lives with obesity, while roughly two in three are above the healthy weight range. The latest major national figures put adult obesity at 31.7% and combined overweight and obesity at 65.8%. Among children aged 2 to 17, 8.3% had obesity and 25.7% were above the healthy weight range.
These numbers cover millions of people, but context matters. Results change with age, sex, income, location, the way weight is measured, and the year studied. A fair reading of Australian obesity statistics must show those differences, not treat one national percentage as the full story.
What do the latest national figures show?
The Australian Bureau of Statistics reported that 65.8% of adults were overweight or living with obesity in 2022. This included 34.0% who were overweight and 31.7% who had obesity. The small gap caused by rounding is normal in published tables.
Men had a higher combined rate than women. About 73.1% of men and 58.8% of women were above the healthy weight range. But the split inside those figures matters. Men were more likely to be in the overweight range, while the gap in obesity alone was smaller.
Children showed a different pattern. About 17.4% of children aged 2 to 17 were overweight and 8.3% had obesity. So around one child in four was above the healthy range.
A child’s result must be checked against growth standards for their age and sex. Adult cut-off points don’t apply directly to growing children.
Obesity in Australia also rises through much of adult life. Rates tend to be lower among young adults, climb through middle age, and then shift again in older age. So a national average can hide wide gaps between age groups.
How is obesity measured in these reports?
Most national reports use body mass index, or BMI. It’s worked out by dividing weight in kilograms by height in metres squared. For adults, a BMI from 25 to 29.9 is classed as overweight. A result of 30 or more is classed as obesity.
BMI gives researchers a cheap, steady way to study large groups. It helps them track changes and compare populations. But it doesn’t directly measure body fat, muscle mass, fat location, fitness, diet, or metabolic health.
Take two adults with the same BMI. One may have lots of muscle and a small waist. The other may carry more fat around the abdomen.
Their health risks may differ, even though they share the same BMI category. That’s why a clinician may also check waist size, blood pressure, blood glucose, medical history, and daily function.
Body weight can change for many reasons. Medicines, illness, sleep, pregnancy, menopause, stress, food access, and the local environment may all play a part. BMI should be used as a screening measure, not a personal diagnosis.
Why do obesity percentages differ between sources?
Survey methods explain many results that seem to clash. One survey may measure people face to face. Another may ask people to report their own height and weight.
People often report being slightly taller or lighter than a direct measurement would show. That can pull the estimated obesity rate down.
Methods also cover who was included, how households were picked, which ages were counted, and how missing answers were treated. Timing counts too. A survey completed in one year shouldn’t be compared with another survey period as if both capture the same moment.
Sample size affects how exact a result can be. A national figure may be reliable, while a number for a small age group or remote area has a wide margin of error. Survey weights help the sample match the Australian population, but they can’t remove every source of bias.
The Australian Bureau of Statistics is the main source for national survey results. The Australian Institute of Health and Welfare combines ABS data, disease records, research, and other sources to explain trends and health effects.
The two bodies may publish figures that look different because they use different years, populations, or definitions. Check the source note before comparing percentages.
Has the adult obesity rate changed over time?
Yes. The long-term trend points upward. In 1995, about 19% of Australian adults had obesity. By 2017 to 2018, the rate was about 31%, and the 2022 estimate was 31.7%.
The share of adults above the healthy range has stayed close to two-thirds in recent national reporting.
This rise doesn’t mean every person gained weight at the same speed. A population shift can happen when more people move from the upper end of the overweight range into obesity. It can also happen when severe obesity becomes more common, even if the combined overweight and obesity rate barely moves.
That difference is easy to miss. A steady combined rate can sit alongside a rise in higher BMI categories. Those higher categories usually bring greater average health risk and may call for more clinical support.
Child rates haven’t followed one neat, straight line. The proportion above the healthy range has stayed near one-quarter across several national surveys, with some movement between survey years. That steady pattern still matters because childhood weight trends can carry into adult life.
Which groups have the highest rates?
Obesity isn’t spread evenly across Australia. Rates tend to be higher outside major cities and in places with greater social and economic disadvantage. A person’s income and surroundings shape the options they have.
Food prices, work hours, housing, transport, access to care, and safe places to move all affect daily choices. Safe places to move include access to gyms and fitness facilities tracked in gym membership statistics.
Adults in lower income areas may see more cheap, energy-dense food and have fewer practical ways to cook fresh meals. Shift work can upset sleep and meal times. Long travel distances can put health care out of easy reach.
These pressures build over years. So advice based only on willpower misses much of what drives the problem.
Aboriginal Australians face a heavier burden. National Indigenous health data have found that around seven in ten Aboriginal and Torres Strait Islander adults are above the healthy weight range, with close to four in ten living with obesity. The exact figure changes with the survey year and whether height and weight were measured.
Results for Torres Strait Islanders need care. Some data group Aboriginal Australians and Torres Strait Islanders because separate samples are too small for stable national figures. Conditions also vary between communities in the Torres Strait, regional centres, and major cities.
A combined figure should never be taken as proof that every community shares the same experience.
These gaps reflect access to affordable food, culturally safe care, housing conditions, income, and the lasting effects of dispossession. They shouldn’t be blamed on a culture or community.
What health risks rise with obesity?
Obesity raises the average risk of type 2 diabetes, cardiovascular disease, several cancers, sleep apnoea, osteoarthritis, kidney disease, and fatty liver disease. Risk climbs further when extra fat is stored around the abdomen.
The link with type 2 diabetes is especially strong. Extra body fat can make the body respond less well to insulin. The pancreas then works harder to keep blood glucose in range. Over time, glucose may stay too high.
Cardiovascular disease covers problems affecting the heart and blood vessels. Obesity can play a part through high blood pressure, abnormal blood fats, inflammation, and diabetes. These paths can raise the chance of heart attack and stroke.
A higher BMI doesn’t prove someone has any of these conditions. Some people with obesity have normal blood tests, while some people in the healthy BMI range have serious metabolic disease. Across a whole population, though, the pattern of risk is clear enough to guide screening and prevention.
Weight stigma causes harm too. People may put off medical care after being blamed or brushed aside. A helpful health talk focuses on symptoms, test results, daily function, and changes that can be kept up. Shame rarely leads to steady care.
What do the statistics leave out?
National figures can’t show why one person gained weight. They also miss some people who live in institutions, lack stable housing, or can’t join a household survey. Small communities may be grouped into broad regions, which can hide local differences.
BMI tables also reveal little about weight cycling. Someone may lose and regain weight several times while staying in the same category at each survey point. One measurement misses the physical and emotional effects of that history.
Severity is another gap. Reporting only the combined overweight and obesity rate can hide growth in class 2 or class 3 obesity. People in those groups may need medicine, specialist nutrition care, psychological support, or bariatric surgery assessment.
One prevention message can’t meet every level of need.
Statistics also struggle to show the food setting around someone. Supermarket access, advertising, serving sizes, work schedules, school food, and household budgets all shape what’s practical. Counting people without studying those settings can lead to weak policy.
How should these numbers guide action?
The figures point to action at both personal and population levels. Health services need to screen for blood pressure, blood glucose, sleep problems, and other risks before symptoms appear. Treatment should fit the person’s medical needs and goals.
At a personal level, useful gains can happen before someone reaches a target BMI. A modest, lasting weight loss can improve blood glucose and blood pressure for many adults with excess weight. Better sleep, more strength, and improved fitness can also help, even when the scale moves slowly.
At a wider level, prevention means making healthier options easier to use. That can include affordable nutritious food, safer walking routes, clear food labels, and early access to health care. Programs work best when they fit the time, culture, income, and transport limits of the people they serve.
When reading a new claim about obesity, use four checks:
- Find the survey year and the age group.
- Check whether height and weight were measured or self-reported.
- Confirm whether the figure covers obesity alone or overweight and obesity combined.
- Look for the original Australian Bureau of Statistics or Australian Institute of Health and Welfare source.
Use the 31.7% adult obesity rate as a national guide, then check the year, population, and measurement method before using it to make a health or policy decision.
Survey methodology influences how Australian obesity statistics are interpreted, as Methodology choices shape the measurement and classification of Human body weight and comparisons by Socioeconomic status.